Title here
Summary here
Whale‑E follows TradingView’s calculation and backtesting conventions wherever possible. The goal is not to guarantee perfect parity in every situation, but to keep its behavior consistent, deterministic, and aligned with TradingView when the test setup is equivalent. With the same settings and the same test context, you will usually get the same signals, trades, and results, subject to the documented limits on this page.
Alignment with TradingView means that the engine reproduces the same strategy calculations and the same main backtesting rules when the test setup is equivalent.
That means using at least the same symbol, the same exchange, the same timeframe, the same analysis period, and the same strategy parameters. If even one of those changes, the results can diverge.
Part of the [backtest] block maps directly to the parameters used by TradingView in the strategy() declaration and in the Strategy Tester settings. During Pine Script export, the engine carries those parameters over into the generated script.
| Key | Purpose |
|---|---|
initial_capital | Sets the initial capital for the backtest. |
default_qty_type | Sets the global position sizing mode: fixed, cash, or percent_of_equity. |
default_qty_value | Sets the value used by the selected sizing mode. |
pyramiding | Sets the maximum number of entries that can be stacked in the same direction. |
commission_type | Sets how fees are applied. |
commission_value | Sets the numerical value of those fees. |
backtest_fill_limits_assumption | Sets the condition a LIMIT order must satisfy to be filled. |
slippage | Sets a fixed slippage in ticks. |
margin_long | Sets the margin requirement for long positions. |
margin_short | Sets the margin requirement for short positions. |
process_orders_on_close | Sets whether an order created on a bar close can also be filled on that same close. |
use_bar_magnifier | Enables intrabar evaluation from a lower timeframe. |
close_entries_rule | Sets the rule used to decide which entries are closed. |
Parameters from strategy() that are not listed in this table cannot be configured in the engine and are not exported to the generated Pine Script. As long as those parameters stay at their default TradingView values, they do not break alignment.
Some backtest settings do not have a direct equivalent in TradingView.
auto_slippage_enabled turns on an engine-specific slippage mode. Once you use it, strict alignment with TradingView no longer applies because TradingView does not provide the same mechanism.
long_size_multiplier and short_size_multiplier are not native TradingView parameters. The engine can still reproduce their effect in the exported Pine Script through the generated logic, so using them remains compatible with alignment.
The end-of-backtest behavior controlled by close_open_position_at_end is explained in the next section.
At the end of a backtest, a position can still be open. The engine then needs a cutoff point to value that position and compute the final portfolio state.
In the engine, close_open_position_at_end controls that valuation boundary. This parameter is true by default. It applies its end-of-backtest convention so the final state stays bounded and comparable from one run to another. It does not change the signals, entries, or exits produced during the backtest. It only affects the final valuation of positions, or legs, that are still open when the test ends.
When close_open_position_at_end = false, the engine stops valuing the position at end_date. The executed trades remain the same, but the final metrics can change because open positions are no longer marked beyond that date.
For example, if your backtest ends on January 31 and a long position is still open on that date, the engine can freeze Open P&L on January 31, while TradingView may keep updating it with the later bars still loaded on the chart.
Both tools can therefore display different final metrics even though the signals, entries, exits, and executed trades stay aligned.
The difference first appears in Open P&L. It also affects Total P&L and some metrics derived from portfolio equity, especially max equity drawdown and max equity run-up. By contrast, metrics based only on closed trades, such as Net P&L or Total trades, do not change.
A difference between Whale‑E and TradingView does not automatically mean that one of the two is wrong. In many cases, the gap simply comes from the test setup or from a limitation specific to either side. Whale‑E stays aligned whenever possible, but does not change its execution semantics just to work around an external constraint.
The most common causes are the following:
mincontract and mintick, can differ between TradingView and Whale‑E. The next section explains this point.auto_slippage_enabled, has no TradingView equivalent.A mismatch can appear when Whale‑E and TradingView do not use the same market constraints, especially mincontract and mintick. By default, the engine uses the values provided by the exchange. For some symbols, TradingView may apply different values.
That gap changes the quantity that can actually be executed. It can then affect how some positions are entered or exited, lead to different partial margin calls, and shift the entire PnL path as well as the trade sequence.
On OKX:BTCUSDT, for example, Whale‑E uses mincontract = 0.00000001, which matches the exchange value, while TradingView uses mincontract = 0.000001. Quantity rounding therefore happens at a different level, and that initial difference can be enough to shift the entire backtest.
When you run a Pine script exported by the engine in TradingView, you may see an orange label in the top-right corner of the chart. The script exports the market parameters used during the backtest, namely mincontract, mintick, and pointvalue. If TradingView applies different values for the same symbol, that label warns you that misalignment is possible.
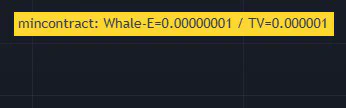
In that case, the engine lets you override the symbol parameters with [[symbol_override]]:
[[symbol_override]]
symbol      = "OKX:BTCUSDT"
mincontract = 0.000001
Without an override, the engine keeps the exchange parameters. With [[symbol_override]], it applies the values you define. On affected symbols, that makes it possible to reproduce the market constraints used by TradingView.
On spot crypto markets, the difference mainly comes from mincontract and sometimes from mintick. pointvalue is usually 1, so it matters much less often.
In the engine, these two ratios are primarily used to compare and rank optimization results. They are calculated from portfolio equity returns observed at each close of the backtest’s native timeframe.
The engine annualizes these ratios to compare strategies running on different timeframes. TradingView uses its own calculation method, notably based on monthly returns. A difference on these two metrics is therefore normal, even when trades and PnL are aligned.
For the full specification, see Metrics.
TradingView and Whale‑E do not measure Buy-and-Hold over the same window.
TradingView calculates Buy-and-Hold from the strategy’s first purchase to the last bar available on the chart, while Whale‑E calculates it from the start to the end of the selected backtest period.
The engine works on a strictly bounded window. Outside “Deep Backtesting,” TradingView relies on the bars that are actually loaded on the chart. “Deep Backtesting” follows different rules, and Whale‑E does not align with it.
For this calculation, the engine only compares the start and end prices of its own reference window. Fees, slippage, execution rounding, and quantity flooring are not part of this calculation.
The percentage is the relative price change between those two bounds. The cash return is then derived from that ratio using the initial capital.